
EU MDR's Benefit-Risk Ratio: Making Your Clinical Evaluations Safety-Focused
By Jayet Moon and Veronica Stephens
 European Medical Device regulations define “benefit-risk determination” as "the analysis of all assessments of benefit and risk of possible relevance for the use of the device for the intended purpose, when used in accordance with the intended purpose given by the manufacturer."
The regulations refer to a benefit-risk ratio multiple times, especially with respect to clinical evaluation and in Sections 1 and 8 of Annex I. However, no universally accepted method exists for calculation of such a ratio. Indeed, this is not an explicit expectation from notified bodies.
This article proposes a method for calculating the benefit-risk ratio in the spirit of focusing on patient safety and, more importantly, the ability to track changes in the safety profiles of products.
MDR expects the clinical evaluation process to “continuously generate, collect, analyse and assess the clinical data pertaining to a device in order to verify the safety and performance, including clinical benefits, of the device when used as intended by the manufacturer.” The clinical data coming out of the evaluation will form the basis of clinical evidence, the intent of which is to “allow a qualified assessment of whether the device is safe and achieves the intended clinical benefit(s).”
“Clinical benefit,” verbatim from the regulation, means the positive impact of a device on the health of an individual, expressed in terms of a meaningful, measurable, patient-relevant clinical outcome(s), including outcome(s) related to diagnosis, or a positive impact on patient management or public health. This must be measured, and systems must be put in place for collection of data and clinical evidence around it.
Article 61 in MDR refers to confirmation of acceptability of the benefit-risk ratio and Article 62 guides the manufacturer to:
(b) to establish and verify the clinical benefits of a device as specified by its manufacturer; (c) to establish and verify the clinical safety of the device and to determine any undesirable side effects, under normal conditions of use of the device, and assess whether they constitute acceptable risks when weighed against the benefits to be achieved by the device.
Thus, we see the extensive data-focused clinical context around the need to quantifiably calculate this ratio. From the post-market side, the MDR, through Article 83, expects the data “gathered by the manufacturer's post-market surveillance system shall in particular be used: (a) to update the benefit-risk determination”. According to Article 86, the periodic safety update report is expected to include the conclusion of the benefit-risk report. The benefit-risk analysis also is part of the technical documentation per Annex II.
This article explores the method to calculate such a ratio from the clinical and post-market data. The example we use is a spinal implant, as shown in Figure 1.

Figure 1: Four steps for implanting lumbar spinal cage.
This Photo by Unknown Author is licensed under CC BY-NC.
Inset picture A shows a vertebra access path. Picture B shows an awl, which clears the space between vertebral bodies that house the disc, in this case, the degenerated disc, which is cleared out. Picture C shows the placement of a PEEK-based lumbar spinal implant in the disc area. The middle part of the implant was filled with allographic fixation material. This lumbar fusion surgery has multiple benefits and risks, which are discussed below.
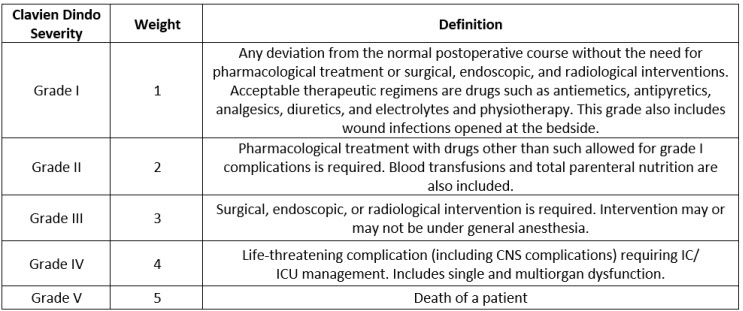
From post-market, literature, and clinical surveillance, one would expect to have a list of harms and their occurrence. These harms can be classified according to various severities. The severities are defined using the well-known Clavien Dindo scale shown in Table 1.
Table 1: Clavien Dindo Severity Grades
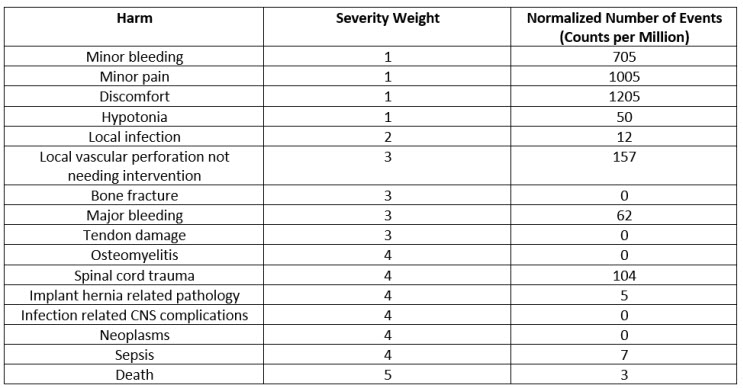
The count of harms classified by severities and normalized by use of the device (sales, in this case) is presented in the Table 2 below. The normalized events are calculated as total events pertaining to a specific harm divided by the number of uses (here, sales). When this is multiplied by a million, we get the normalized rate in counts per million, as seen in the last column in the Table below.
Table 2: Harms, Severity Weights, and Normalized Rates in CPM
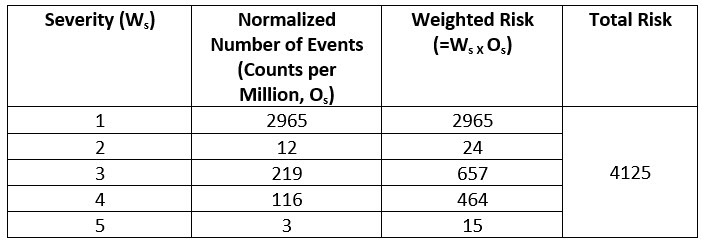
This normalized CPM count is weighed with respect to the grade of severity. For example, severity 5, which is death, carries the most weight, i.e., five times more than the severity 1 events. This weighted risk is calculated for each grade and then weighted risks of all grades are added to calculate total risk as shown below.
Table 3: Weighted Risk by Severity Grades and Total Risk
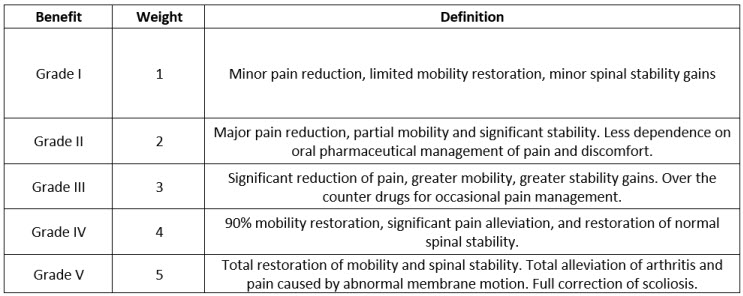
For this type of device (spinal implants), a special benefits scale of five grades was developed as shown below.
Table 4: Benefits Scale
Again, using proactive post market surveys (PMCF et al.), literature surveys, and clinical surveillance, a list of benefits is collated and classified according to the grade of the benefit. The count of benefits classified by grade and normalized by use of the device (sales, in this case) is carried out. The normalized rate is calculated as total number of benefits pertaining to a specific benefit grade divided by the number of sales. When this is multiplied by a million, we get the normalized rate in counts per million as seen in the Table 5 below.
Table 5: Weighted Benefits by Grade and Total Benefit
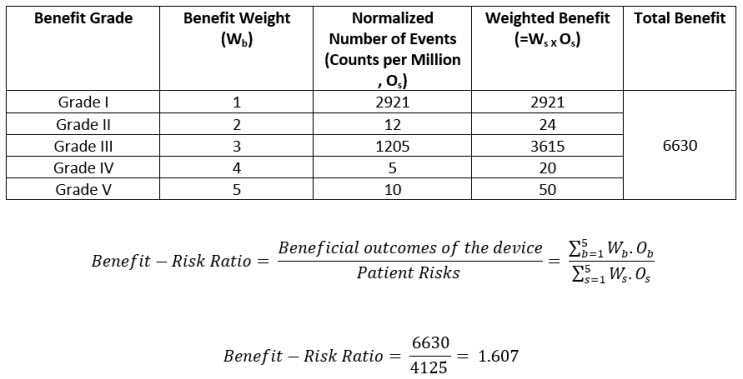
The benefit-risk ratio should always be greater than one. This is the overall risk acceptability criteria.
In this fashion, the benefit-risk ratio can also be calculated for competitor or similar devices. The sales or uses of the devices for normalization purposes can be estimated by using market share. If that information is not available, then, to be conservative, use the same number of uses/sales as your device. This would mean that the calculation is compared solely on the basis of reported harms and reported benefits – a completely acceptable thing to do, even if it is somewhat conservative.
Article 88 of EU MDR mentions that trend reporting is required for “any statistically significant increase in the number or severity of incidents that are not serious or in expected side-effects that could have a significant impact on the benefit-risk analysis and which could lead to unacceptable risks….”. This means that the lower severity grade events, which also contribute to the benefit-risk ratio, as we have seen, are also expected to be monitored and considered in evaluation of overall benefit-risk. This article provides a good method to do that. The simplicity of the method also provides a direct verification of impact of every harm and every grade of severity of the harm on the benefit-risk ratio. This method allows the recalculation and repeated verification of the benefit-risk ratio as more issues, adverse events, harms, and benefits are reported.
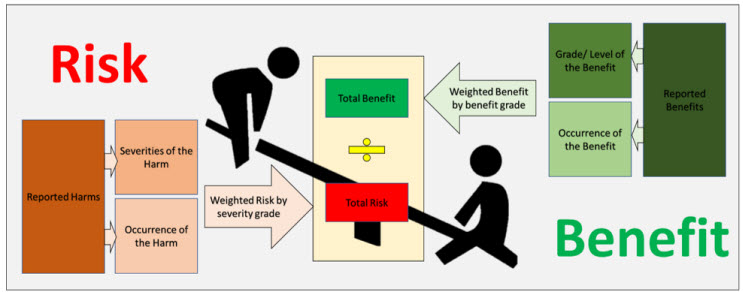
Figure 2: An Overview of the Benefit Risk Method
Thus, we have presented a simple yet powerful method for calculating the benefit-risk ratio (a macro overview is shown in Figure 2). However, the success of this method depends on the choice of grading scales for severity and benefits. We recommend defining a scale suited to the type of product under analysis (here, spinal products). Success of this method is also founded upon proactive post-market and clinical surveillance, with equal focus on both. If a company just reactively collects complaint data and carries out no studies or surveys regarding benefits, the clinical evidence becomes lacking and the ratio can become lopsided. Needless to say, it’s not a one-time activity. When done right, however, this method can act as a great indicator of the holistic safety profile of your product throughout the life cycle of the device.
About The Authors:
 Jayet Moon earned a master’s degree in biomedical engineering from Drexel University in Philadelphia and is a Project Management Institute (PMI)-Certified Risk Management Professional (PMI-RMP). Jayet is also a Chartered Quality Professional in the UK (CQP-MCQI). He is also an Enterprise Risk Management Certified Professional (ERMCP) and a Risk Management Society (RIMS)-Certified Risk Management Professional (RIMS-CRMP). He is a Fellow of the International Institute of Risk & Safety Management. His new book, Foundations of Quality Risk Management, was recently released by ASQ Quality Press. He holds ASQ CQE, CQSP, and CQIA certifications.
 Veronica Stephens is the senior vice president of quality and risk management solutions for the firm Auchincloss-Stephens. She is a risk management subject matter expert with over two decades of experience in Fortune 500 companies across a range of industries, including pharmaceuticals, food production, consumables, durables, and medical devices.