
Investigator Payments – Channels, Cycle Time and Benchmarks
By Mathini Ilancheran, senior delivery lead - research, R&D, Beroe Inc.

By Mathini Ilancheran, Senior Research Analyst- Clinical Research, Beroe Inc.
Investigator payments contribute to approximately 48 to 50 percent of the total per trial costs. Travel, food, and lodging account for 77 percent of the total investigator budget. Planning and understanding the key parameters within the investigator payment / grant process is important before devising a suitable payment strategy. Considering the fair market value for investigator payments is crucial in order to avoid higher payment which may result in financial strain on the sponsor. Let us explore the types of channel payments, average cycle time, and benchmarks related to the investigator payment process.
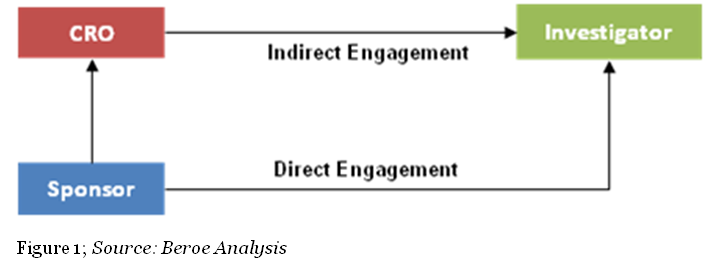
Channels: Within the pharma industry, investigator payments can be processed through direct and indirect channels. In the direct channel, the engagement is between the trial sponsor and the investigator (physician), whereas in the latter, CROs or other clinical trials payment specialists serve as a mediator between the sponsor and the investigator (Figure 1). In terms of negotiation, during direct engagement the actual payment schedule is subject to negotiation with the company. The principal investigator and departmental administrators would develop a suggested payment schedule that is based on the spending pattern anticipated for the study.1 In the case of indirect engagement, the role of a third party service provider is limited to the operations of a site. CROs, along with the sponsor, would undertake the recruitment of investigators. However, the sponsor is the primary contract partner and holder with the investigator for liability reasons.
Both direct and indirect channels have their own benefits and risks. Enhanced sponsor- investigator relationships with little quality compromise during investigator recruitment can be achieved through a direct payment channel. However, there would be a risk of little know-how on fair market value resulting in higher payment, which puts up financial strain and increases management burdens on the sponsor’s side. On the other hand, in choosing an indirect payment channel, sponsors could encounter streamlined negotiations, improvement in budget management and financial control, enhanced investigator availability, payments in line with contracts, and accelerated cycle times. Risks for this channel could include diminished enrolment ethics, unethical activity, or breach of code of conducts which would impact the sponsors.
In general, large pharma companies prefer to pay investigators in milestones. On average, initial payment can be as high as 20 to 30 percent of the total grant, and the rest of the payments are made based on enrolment or other milestones depending on study type. In emerging markets such as India and China, the adoption levels for indirect engagement is as high as 80 to 100 percent as major pharmaceutical companies do not have direct presence in these regions.
Cycle Time: Payment frequency mainly depends on the fund source, whether it is pharma or an academic institute, as well as the region. For example, the investigator payment cycle preferred by academic institutions in North America is two weeks to a month, whereas in Europe and APAC, it is a monthly or quarterly cycle. Frequency of payment also depends on the type of study. Difficult studies with low patient numbers are paid on a monthly per patient basis, whereas studies with low complexity and documentation needs and high patient numbers may be paid on a weekly or biweekly basis. In India, a small amount is paid at the initial visit to encourage investigators to retain patients. Typically, payments are made on a per visit schedule (i.e., cost per visit times total number of patients). Monthly site payments are used to provide wages and salaries for support staff. Pharma needs to be aware of the average cycle times to ensure there is no unnecessary delay in the payment process.
Benchmarks: The market rate of investigator fees is critical to pharma as higher pay would evaporate the budget, and lower pay would make it more difficult to hire experienced investigators. The average investigator payment was $6,900 in 2012, but this varies widely based on the phase of the study, region, therapeutic area, and compound type.3 Of the different phases, pharma typically negotiates for a lower cost in Phase 3 trials, with an average estimated budget of $33,000 to $34,000 for principle investigator compensation.4 The estimated average per patient fee per region is shown in Figure 2 below.2
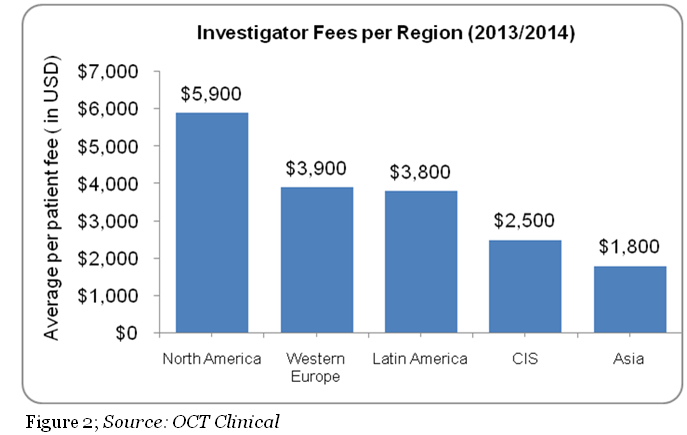
The U.S. and Europe have a higher average per patient fee compared to the emerging markets, Latin America, CIS, and Asia. Cost of investigators is estimated to be higher in the U.S compared to Europe due to a number of potential factors. For example, in the U.S., investigators are likely to face higher operating costs to manage their research activities. In Asia; the procedure costs in India are 20 to 25 percent of the costs in the U.S. with investigator fees budgeted on a per visit basis. In Russia, under the regulations passed in September 2010, principal investigators are required to have at least five years of trial experience, which would result higher quality investigators. In China the average procedure costs are 30 to 40 percent of the cost in the U.S. with investigator fees usually budgeted on a per visit basis.
Furthermore, trial length and complexity also cause variations in payment levels. Highly complex diseases, such as oncology, tend to be more expensive than other studies due to the higher number of procedures dealt with in each therapeutic area. For example, as per IMS health, the total cost negotiated with an investigator to complete all protocol activities for a single patient in an oncology trial is $ 18,654, whereas that of the less expensive cardiovascular therapeutic area is $7,458. Pharmaceutical companies should be aware of the fair market value and price trends based on regions and therapeutic area to ensure a smooth payment budgeting process by hiring the right investigator without evaporating the budgets.

Mathini Ilancheran, Senior Research Analyst- Clinical Research, Beroe Inc.
References
- UC San Diego. PI-Initiated vs. Industry-Initiated Clinical Trials Reference Guide. February 2014. http://blink.ucsd.edu/research/preparing-proposals/clinical-research-trials/pi-vs-industry.html (accessed 2015).
- OCT . OCT - Russia-CIS & MENA-Turkey. May 2013. http://www.oct-clinicaltrials.com/news/detail.php?ELEMENT_ID=324 (accessed 2015).
- Klein, Jeremy. Benchmarking Investigator Payments. December 2012. http://www.appliedclinicaltrialsonline.com/benchmarking-investigator-payments (accessed 2015).
- Cutting Edge Information. CLINICAL INVESTIGATOR COST CUTTING. http://www.cuttingedgeinfo.com/2011/new-study-highlights-clinical-investigator-cost-cutting/ (accessed 2015).