
The Site Landscape Is Evolving, But How? Tufts CSDD Shares New Findings
By Abigail Dirks, MS, Joan Chambers, and Kenneth Getz, MBA, Tufts Center for the Study of Drug Development (CSDD), Tufts University School of Medicine

Editor’s note: The data presented below will also be discussed detail at an upcoming Clinical Leader virtual event. Details are forthcoming.
The global investigative site landscape transformed substantially over the past 15 years. The landscape includes independent sites but also larger site networks, clinical trials embedded within pharmacies and health service delivery organizations, and visits and procedures using remote and home-based approaches. Although these models share common objectives — to improve operational efficiency and expand access and convenience for clinical trial participants — they differ considerably in their capacity, capabilities, operating structures, and requirements for sponsor and CRO engagement, oversight, and support.
Despite this major transformation, there is virtually no research in the literature that has characterized these landscape changes and how study conduct segment operations and performance differ. Greater understanding of the global site landscape will help distinguish mature from developing segments, inform more differentiated approaches to site engagement, and identify new opportunities to optimize clinical trial performance.
By providing an integrated view of the evolving site landscape, our aim is to address an important knowledge gap and provide a foundation for more evidence-based approaches to site selection, management, and engagement. Ultimately, a deeper understanding of site capabilities and operating models may enable sponsors and CROs to develop more strategic and enduring partnership relationships.
Methodology
The Tufts CSDD research team collaborated with a working group of 10 sponsor and CRO companies to characterize the global site landscape and compare performance across site segments. Using a mixed-methods approach, the team conducted a global survey from late February through early April 2025 among sites registered on ClinicalTrials.gov. The survey collected site characteristics and trial experience, while sponsors and CROs separately provided site- and protocol-level performance data from one to three studies each.
Study data was amended using the Bioresearch Monitoring Information System (BMIS) maintained by FDA. This data set provided information on the volume of global industry-funded clinical trial activity per principal investigator in a trial. The data set was filtered to only include clinical investigators. Clinical investigators in the data set were next categorized into each of the three primary segments according to their site affiliation. A list of site networks and academic centers were created by Claude AI and manually reviewed. Then regular expressions were used to match the text of the site. In addition to common academic centers, words like “University” and “School of Medicine” were used to label AMC-affiliated centers. Then the average trial volume per principal investigator in the last five years per segment was calculated. This was then multiplied by the number of principal investigators reported for each site to approximate the number of clinical trials per site over the last 5 years. Finally, the team conducted descriptive analyses and hypothesis testing using RStudio.
The Results Are In: Segmentation, Distribution, Staffing, & More
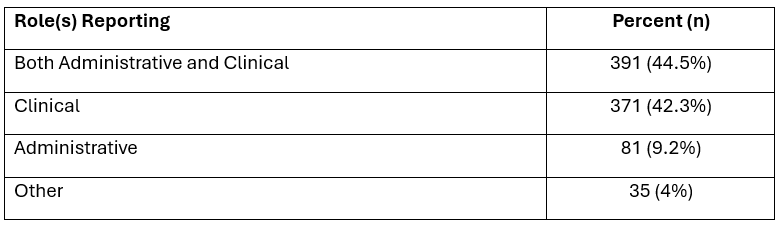
We collected 1,154 responses from personnel at sites, across an estimated 1,090 unique sites. We assumed responses were from the same site if they had identical values for the following characteristics: conducts rare disease trials or not, first year of clinical study, geographical location, whether they were part of a site network, ownership structure; if annual trial volume was within ±10 trials; and if 80% or more of the therapeutic areas and phases of study listed were identical. Most respondents were in a clinical role, either only clinical (42.3%) or both administrative and clinical (44.5%), while 275 responses did not answer this question (Table 1).
Table 1: Respondent Characteristics
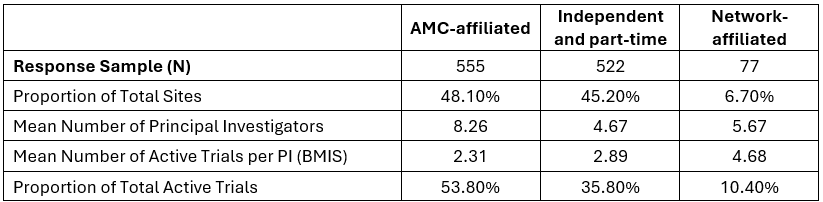
Across the global survey sample, 48.1% of sites self-reported as AMC-affiliated centers, 45.2% as independent and part-time centers, and 6.7% as network-affiliated centers. AMC-affiliated centers averaged over eight principal investigators, independent and part-time averaged almost five principal investigators, and network-affiliated sites averaged almost six principal investigators. However, network-affiliated principal investigators averaged almost five 1,572 filings in the last five years, while AMC-affiliated principal investigators averaged a little more than two filings and independent and part-time averaged almost three filings.
These averages helped us to estimate the comparative proportion of total active clinical trials. Overall, whereas 6.7% of sites were network-affiliated, they conducted 10.4% of active global FDA-regulated clinical trials. Independent and part-time sites comprised 45.2% of total sites but conducted 35.8% of active global clinical trials. AMC-affiliated centers represented 48.1% of total active sites and conducted 53.8% of total active global FDA-regulated clinical trials.
Table 2: Share of Total Clinical Trial Activity
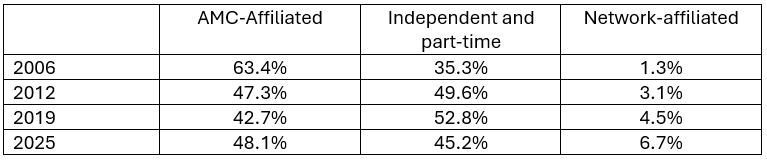
Network-affiliated sites now make up about 6.7% of the landscape, up from 1.3% in 2006. In 2019, independent and part-time centers made up 52.8% of total active sites. In 2025, this segment’s share of total sites dropped to 45.2%. AMC-affiliated centers saw a slight decline in 2019 followed by increasing share through 2025 (Table 3).
Table 3: Site Landscape Segmentation (Share of Total Active Sites)
Only 15.3% of AMC-affiliated centers engaged in vaccine trials, compared to 61.0% of network-affiliated sites (Table 4). A high relative percentage of network-affiliated sites are conducting research in cardiovascular/metabolic, dermatology, and respiratory diseases. About one-fifth of network affiliated sites report conducting a high volume of vaccine clinical trials. Top therapeutic areas by site segment appear in Table 4.
Table 4: Distribution of Sites by Active Therapeutic Area
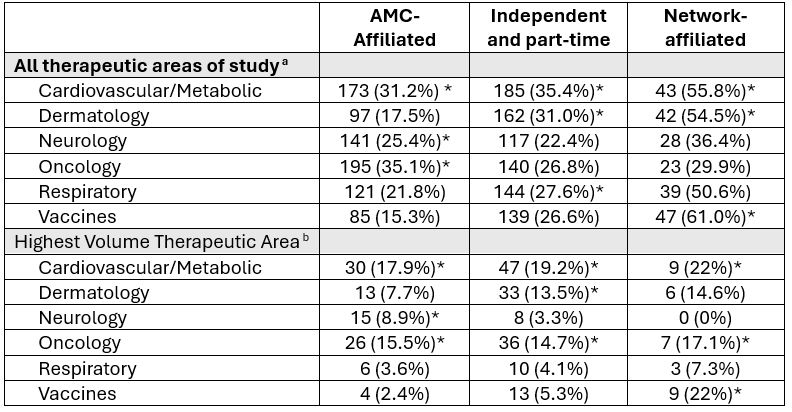
a. Sites were asked to select all that apply.
b. For sites that reported the number of studies within each therapeutic area, the therapeutic area in which they reported the highest number of studies.
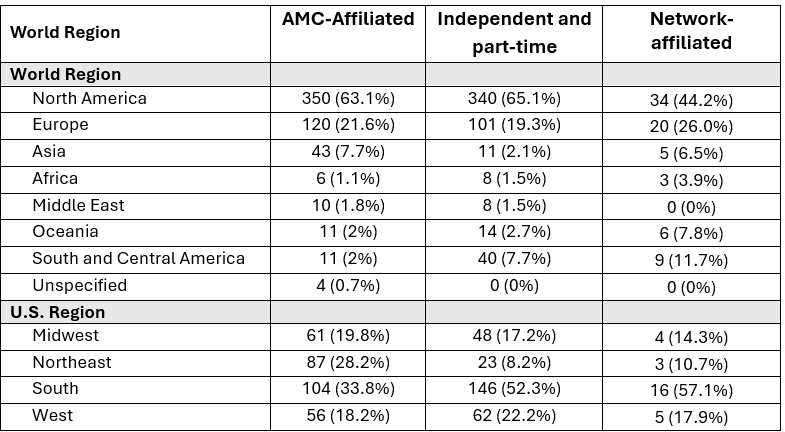
A high relative percentage (45-65%) of sites are operating in North America. Approximately one-quarter are operating in Europe. Table 5 presents the distribution of active sites by global geographic area.
Table 5: Distribution of Sites by Geographic Area
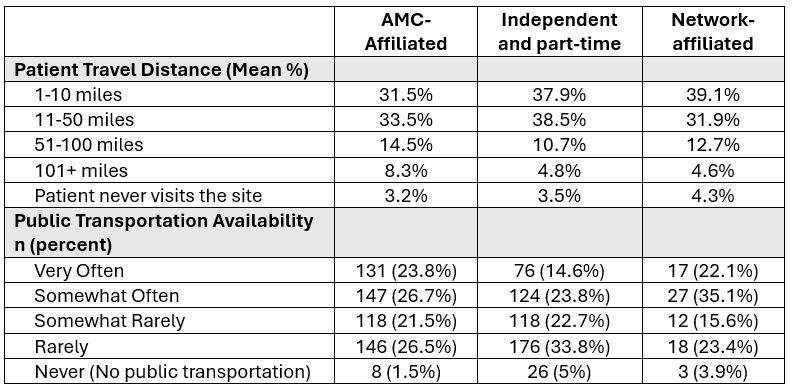
In terms of patient proximity and access to the site, AMC-affiliated centers had the highest proportion of patients traveling over 100 miles on average. Independent, community-based and network-affiliated sites had about 38-39% of their patient population travel only 1-10 miles to the site. Participants used public transportation “very often” in 23.8% of AMC-affiliated sites, 22.1% of network-affiliated sites, and 14.6% of independent and part-time sites. Less than one in 20 (5%) independent and part-time sites and almost 4% of network-affiliated sites do not have public transportation available to their site (Table 6).
Table 6: Patient Access by Segment
AMC-affiliated sites had the highest annual clinical trial volume and total number of clinical staff, averaging 27.3 trials per year and 43.1 clinical staff members. High variation occurred in the size and trial volume data reported. Network-affiliated sites reported an average of 20.4 trials conducted per year, and independent and part-time sites reported an average of 15.2 trials per year.
Independent and part-time sites and network-affiliated sites reported average head count of 23.9 and 22.0 clinical staff, respectively. The number of administrative staff for each segment averaged between 3.0 to 4.6, with an overall average of 3.9. Independent and part-time sites and AMC-affiliated sites averaged 59.0% and 57.1% of clinical staff with more than 6 years of experience. Less than half (44.0%) of clinical staff at network-affiliated sites had more than 6 years of experience. More than half of admin staff across all segments had a reported mean of six or more years of experience (Table 7).
Table 7: Staffing and Portfolio Size by Segment
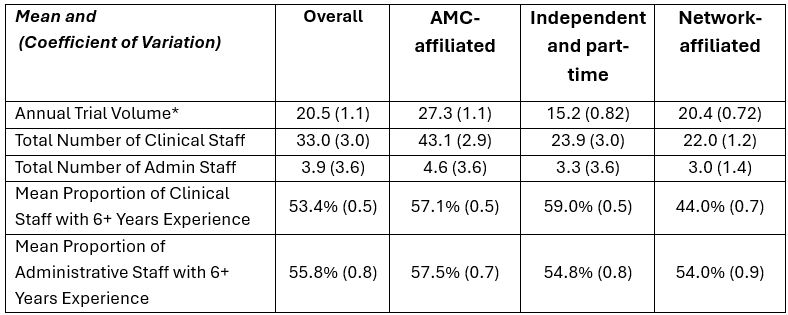
*Outliers removed
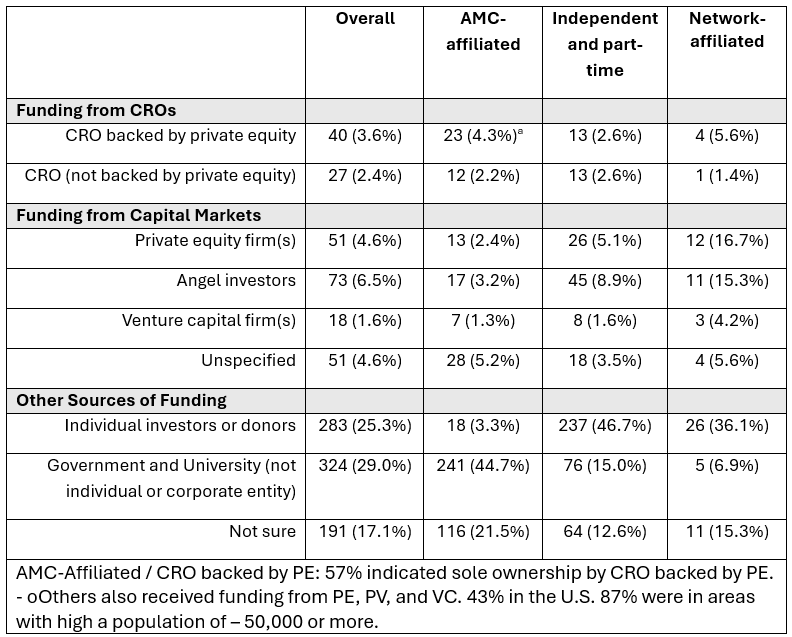
Across all site settings, about 6% received funding from CROs, 17.3% received funding from capital market entities (e.g., private equity and venture capital firms), and approximately 54.9% received funding from individuals or other groups, including academic institutions or government. Nearly 20% of sites were unsure of their funding sources (Table 8).
Table 8: Funding Sources Reported
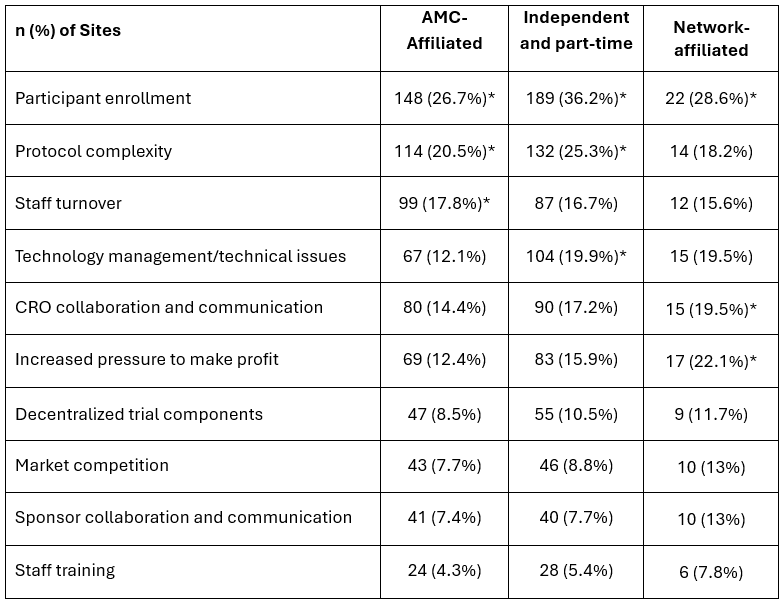
The top three reported challenges by sites appear in Table 9. Top challenges for each segment included participant enrollment, protocol complexity, and staff turnover. Over 17% of sites indicated one of these within their top three. Over one-fifth of network-affiliated sites (22.1%) indicated that the increased pressure to make profit was a top challenge. Another 19.5% of network-affiliated sites and 17.2% of independent and part-time sites indicated that communicating and collaborating with CROs was a top challenge.
Table 9: Top Reported Challenges
What Sponsors Say About Site Performance
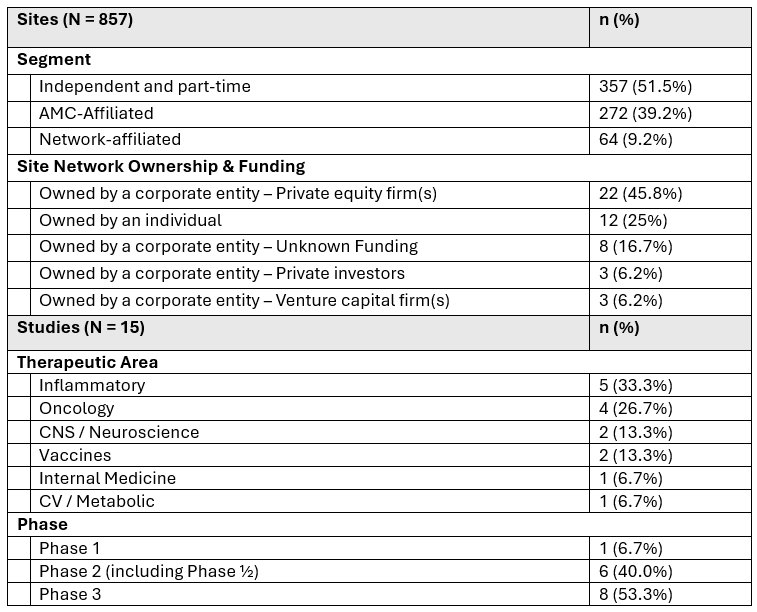
Characteristics of the sponsor-reported sample, including 857 sites and 15 studies, appear in table 10. The sample included about half independent and part-time sites, almost 40% AMC-affiliated sites, and over 9% network-affiliated sites. Site networks in this sample were most commonly funded by private equity firms (45.8%) or by an individual (25%). Performance data was provided for the following studies: five inflammatory; four oncology; two CNS/neuroscience; two vaccines; and one internal medicine. One reported study was in Phase 1, six were in Phase 2, and eight were in Phase 3 (Table 10).
Table 10: Sponsor-Reported Sample Characteristics
Within this sample, sponsors provided performance data across 693 sites. Network-affiliated sites had the lowest randomization rates (33.1%) but showed the highest completion rates (80.2%). AMC-affiliated site averaged screen failure rates of 36.9%, 63.1% randomization rates and 24.0% completion rates with high coefficients of variation around the reported means. Independent and part-time sites averaged a 41.4% screen failure rate, 59.9% randomization rate, and 41.8% completion rate. For each segment, actual time from FPI to LPI (first patient in to last patient in) was about half of planned time (Table 11).
Table 11: Sponsor-Reported Performance by Segment
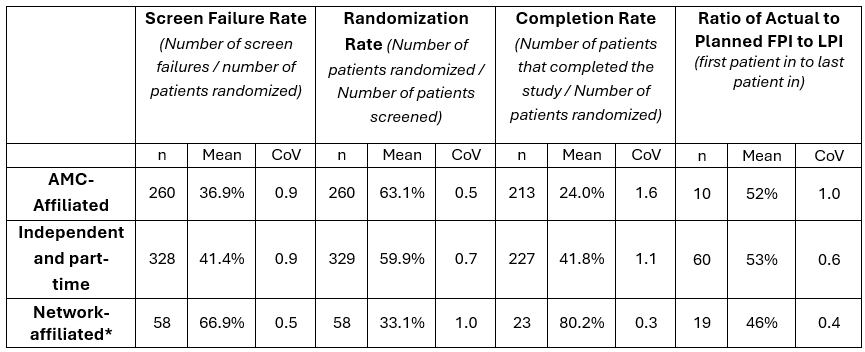
CoV – Coefficient of Variation
*16% of the community-based for-profit site networks are part of vaccine trials, which tend to have lower screen failure rates, higher randomization rates, and higher completion rates.
Significant differences found in completion and screen failure rates between segments (p < 0.001, ANOVA). Community-based for-profit site networks had the highest screen failure rate on average (p < 0.001, Tukey post-hoc).
How The Landscape’s Evolving: A Synopsis
Historically, AMC‑affiliated and independent research centers have dominated the site landscape. However, the proportion of network-affiliated sites has shown a steady increase over time, making up almost 7% of sites and capturing over 10% of clinical trial activity.
The AMC-affiliated site segment conducts the largest volume of active industry-funded clinical trials, averaging 27.3 trials per year. AMC-affiliated site infrastructure is relatively high, averaging 43 clinical staff compared to network-affiliated centers with an average of 22 staff and independent and part-time centers averaging 24 staff. Network-affiliated centers report having a less experienced workforce, with about 66% of clinical staff having less than six years of experience. A high percentage of network-affiliated sites are capital market funded; independent sites are largely funded by individual investors. Sponsor-reported enrollment performance differed across site segments, with network-affiliated sites showing lower randomization rates but higher completion rates.
During the past decade, the global site landscape has been assessed from a variety of perspectives including by access to targeted patient communities and socioeconomically disadvantaged populations, and by capabilities.3,4 , To our knowledge, this is the only recent study to provide an updated segmentation by setting, performance, and sources of funding.
An understanding of the evolving site landscape is essential for sponsors and CROs in informing site selection and management strategies and practices. Consolidation and maturation of the global site landscape signals the presence of scaled operating elements including centralized management controls, standardized workflows, more established technology systems and infrastructure, and broader geographic reach. These changes may facilitate improvements in operational consistency, accelerated tasks, and improvements in operating efficiency. However, a consolidated landscape faces intensifying competitive pressures, high levels of staff turnover, and the potential influence of investor‑driven priorities on research conduct and participant engagement.5,6
Conclusion: AMCs Regain, and Site Networks Gain, Market Share
The results of this study show a reversal of the multi-decade decline of academic-affiliated site share of active industry-funded clinical trials and the continued growth of the network-affiliated site model. Comparative performance data suggests that network-affiliated sites may offer patient enrollment advantages. However, the primary limitation is the low sample size of the sponsor-reported performance data. Further research is needed to better assess comparative site segment performance.
References:
- Florez MI, Botto E, Kim JY. Mapping Strategies for Reaching Socioeconomically Disadvantaged Populations in Clinical Trials. JAMA Netw Open. 2024;7(6):e2413962. doi:10.1001/jamanetworkopen.2024.13962
- Gottlieb, N., Byrne, J., & Getz, K. (2020). Investigative site placement practices to support Operation Warp Speed. Applied Clinical Trials, 29(12), 26–28.
- Society for Clinical Research Sites. (2024). 2024 Site Landscape Survey White Paper. https://myscrs.org/learning-campus/white-papers-guides/.
- Society for Clinical Research Sites. (2025). 2025 SCRS Landscape Survey Report. https://myscrs.org/learning-campus/white-papers-guides/.
- Society for Clinical Research Sites. (2024). 2024 Site Landscape Survey White Paper. https://myscrs.org/learning-campus/white-papers-guides/.
- Society for Clinical Research Sites. (2025). 2025 SCRS Landscape Survey Report. https://myscrs.org/learning-campus/white-papers-guides/.
About The Authors:
 Abigail Dirks is a senior data scientist at Tufts CSDD where she specializes in analyzing large datasets pertaining to all aspects of industry-funded drug development performance including protocol design complexity, investigative site burden and experience, RBQM adoption, CRA performance, DCT use and impact, patient recruitment and retention and study volunteer participation burden. During her tenure at CSDD, Abigail has helped the team embrace and utilize automation, modeling and simulation, and AI-enabled approaches to optimize data value and analytics. Abigail has published the results of her studies in peer-review journals and in the trade press. She has also presented at major industry conferences. She received an MS in health informatics and analytics from Tufts University School of Medicine, Boston, MA and a BS in data science and mathematics from St. Michael’s College, Colchester, VT.
 Joan Chambers is a senior consultant advising research projects and Tufts CSDD’s membership programs. She brings more than 30 years of senior management experience across a variety of strategic and operating roles in the life sciences industry. Joan serves on several boards and committees, including U.S. PharmaTimes, the Pharmaceutical Business Conference Group, and One Rare. Joan is an active member of DIA, has published extensively in trade journals, and is a frequent speaker at industry conferences.
 Ken Getz is the executive director of the Tufts CSDD and a research professor at the Tufts University School of Medicine. He is an internationally recognized expert on pharmaceutical R&D management and execution, protocol design, contract service provider and investigative site management, eClinical technology and data usage, and patient engagement. A well-known speaker at conferences, symposia, universities, investor meetings, and corporations, Ken has published extensively in peer-reviewed journals, books, and the trade press. He holds board appointments in the private and public sectors. He received his MBA from Northwestern University and his bachelor’s degree from Brandeis University. Ken is also the chairman of CISCRP — a nonprofit organization that he founded to educate and raise public and patient awareness of the clinical research enterprise — and the founder of CenterWatch, a leading publisher in the clinical trials industry and one of several businesses that he has sold.