
An Introduction To Contingency Tables For Clinical Study Analysis
By Elaine Eisenbeisz, Omega Statistics

I would guess every researcher has come across a contingency table. Contingency tables are a type of classification table used in statistics to simultaneously summarize relationships between two categorical variables. (Let's call them Variable X and Variable Y.) Contingency tables are also called two-way tables, cross-tabulation tables (cross-tabs), and frequency distribution tables, because statisticians like to have at least three to five names for everything.
Contingency tables can be used to summarize probability distributions, namely (a) joint, (b) marginal, and (c) conditional distributions. As you can see from the definitions below, the sum of probabilities in each type of distribution must add up to one, which in statistician thinking is 100 percent.
- The joint distribution is the proportion of the subjects jointly classified by a category of Variable X and a category of Variable Y. Each of the cells of the contingency table divided by the total number of subjects provides the joint distribution for the particular cell. The sum of the joint distributions is one.
- The marginal distributions describe the distribution of the Variable X (row) or Variable Y (column) variable alone. The row and column totals of the contingency table provide the marginal distributions. Probabilities are taken as the sum of a row (or column) divided by the total number of subjects. The sum of probabilities in a marginal distribution is one. These distributions are called marginal because you find them in the margins of the table.
- The conditional distributions describe the distribution of Variable X given the levels of Variable Y. A cell of the contingency table divided by the row or column total for that cell provide the conditional distributions. The sum of a conditional distribution is one.
The simplest type of contingency table is a 2x2 table, with two levels of Variable X and two levels of Variable Y. However, they can be larger than 2x2, and they do not have to be uniform. One can have 2x6 tables if they want. However, the different distributions must add up to one (100 percent), as noted above.
Contingency tables can be used to derive much more than distributional probabilities, and this is why they are so useful in clinical research and diagnostic testing to compare observed effects with effects predicted from a statistical model, such as a logistic regression, or to investigate adverse events between treatment arms.
In this article I will show a simple 2x2 contingency table and how you can derive many useful statistics from the information presented. Figure 1 is a template of how to set up the classification table; each of the fours cells is given a letter for reference (a, b, c, or d).
Figure 2 is a contingency table with data comparing the subjects in two study arms of (a) treatment or (b) control, with the occurrence of an adverse event (AE; AE = yes vs. AE = no). Each of the 1,000 study subjects was classified into only one of the four available cells in the classification table.
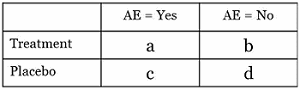
Figure 1: Contingency (cross-tabulation) table with cell descriptors (a, b, c, d) for ease of reference
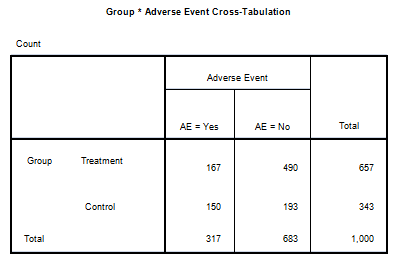
Figure 2: Contingency (cross-tabulation) table of the Variable X (study arm: two levels of treatment vs. control) and Variable Y (adverse event classification: two levels of adverse event = yes vs. adverse event = no). A total of 1,000 subjects were classified.
The probability distributions can be found as:
Joint Distributions of the Four Cells:
- Cell A. Treatment and AE = Yes: 167/1,000 = 16.7 percent
- Cell B. Treatment and AE = No: 490/1,000 = 49 percent
- Cell C. Control and AE = Yes: 150/1,000 = 15 percent
- Cell D. Control and AE = No: 193/1,000 = 19.3 percent
The four percentages add up to 100 percent (probability of one). So that is good!
Marginal Distributions of Rows (Variable X, Study Arm)
- Treatment group membership = 657/1,000 = 65.7 percent
- Control group membership = 343/1,000 = 34.3 percent
The percentages of the two rows add up to 100 percent. We're happy!
Marginal Distributions of the Columns (Variable Y, Adverse Event Status)
- Adverse event: Yes = 317/1,000 = 31.7 percent
- Adverse event: No = 683/1,000 = 68.3 percent
The percentages of the two columns add up to 100 percent. We're still happy!
Conditional Distributions
- AE = Yes, conditional on the treatment arm: 167/657 = 25.4 percent
- AE = No, conditional on the treatment arm: 490/657 = 74.6 percent
- AE = Yes, conditional on the control arm: 150/343 = 43.7 percent
- AE = No, conditional on the control arm: 193/343 = 56.3 percent
- Treatment arm member, conditional on AE = Yes: 167/317 = 52.7 percent
- Control arm member, conditional on AE = Yes: 150/317 = 47.3 percent
- Treatment arm member, conditional on AE = No: 490/683 = 71.7 percent
- Control arm member, conditional on AE = No: 193/683 = 28.3 percent
Each of the four pairs adds up to 100 percent, so we are totally happy!
But wait, there's more! The cells of the 2x2 contingency table can be used to derive many other useful statistics and measurements. I won't go into detail on each one. Figure 3 is a presentation of measurements and associated formulas that can be used to derive numbers from contingency tables. In the formulas, N is the total number of subjects. (We used 1,000 subjects in our example.)
Some of the measurements are better used in diagnostic or genetic testing. I adjusted the contingency table cell names to show the proper setup for predicted vs. observed values.
However, some of the formulas are useful in our example of adverse events. For instance:
- Prevalence can be considered as the proportion of all subjects who experienced an adverse event: (167 + 150)/1,000 = 31.7 percent.
- The ratio of odds of a subject experiencing an adverse event in the treatment arm vs. the control arm would be (167*193)/(150*490) = 0.21. This suggests a subject in the treatment arm is about (1 – 0.21) = 79 percent less likely to experience an AE than if he was in the control arm.
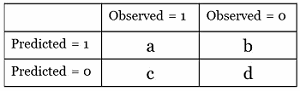
Figure 3: Generic contingency table format and table of measurement formulas
As we've seen, statistics do not have to be complicated to be useful. Contingency tables are a great example of setting up your numbers in a particular way so that you can obtain important information with just simple math. I didn't cover statistical tests for contingency tables. However, if you would like to learn more about contingency tables and the statistical tests that can be used with the tables (such as chi-square and Fisher's Exact Test), check out my webinar Chi-Square and Friends: Fun with Contingency Tables. It is an overview, but I include some more details and a few references.
I would also like to know what statistical concepts or applications you want to know more about, so I can write future columns that are interesting and informative. So let me know your ideas by posting a comment below or by emailing me at elaine@OmegaStatistics.com.
About The Author
 Elaine Eisenbeisz is a private practice statistician and owner of Omega Statistics, a statistical consulting firm based in southern California.
Eisenbeisz earned her B.S. in statistics at UC Riverside, received her master's certification in applied statistics from Texas A&M, and is currently finishing her graduate studies at Rochester Institute of Technology. She is a member in good standing with the American Statistical Association and a member of the Mensa High IQ Society. Omega Statistics holds an A+ rating with the Better Business Bureau.
Eisenbeisz works as a contract statistician providing study design and data analysis for private researchers and biotech startups as well as for larger companies such as Allergan and Rio Tinto Minerals. Throughout her tenure as a private practice statistician, she has published work with researchers and colleagues in peer-reviewed journals. You can reach her at (877) 461-7226 or elaine@OmegaStatistics.com.