
An Introduction To Financial Benchmarking In Biopharma Clinical Development
By Larry Ajuwon, RHIEOS-Ventures Ltd., and Mathini Ilancheran, Beroe Inc.
The high cost and failure rate of new drug candidates going through clinical trials are well documented and a recurring subject of research both by industry and academia.1 Further, the cost of drug development is a debated topic, and there is no consensus on what the “true cost” is because of the different methods used for these calculations.2 The lack of adequate comparable cost data and value measures also makes it difficult for pharmaceutical sponsors and trial sites to implement financial benchmarking for planning, costing, and budget management.
This paper provides an overview of the various tools and practices used in the management of pharmaceutical industry sponsored clinical research programs. It also highlights some of the key issues and barriers to financial benchmarking and presents a case study application.
Defining Financial Benchmarking
Per the APQC (American Productivity & Quality Center), benchmarking is the process of comparing and measuring your organization against others, anywhere in the world, to gain information on philosophies, practices, and measures that will help your organization act to improve its performance. Financial benchmarking involves defining, collecting, analyzing, and using internal and external financial data to improve financial processes, deliver cost efficiencies, and increase productivity.
A Typical Clinical Development Planning Scenario
A clinical stage biotech company is co-developing a new drug for an oncology indication using its proprietary biology platform technology and is planning to start Phase 2 clinical trials. Its partner pharmaceutical company will be responsible for the study in Europe and the rest of the world (ROW) under a co-development and license contract, while the biotech will run the study in the Americas. The key investigator site (U.S.) would, however, like to conduct a financial feasibility assessment to estimate the per-patient cost of conducting the study at its site.
How much should we plan for? What’s the budget going to look like? How can we design a study such that it delivers value for money (in terms of patient outcome) and the data quality to meet regulatory approval? These are some of the questions raised that can best be answered if the parties have comparable benchmark pricing and cost data, which can be used to plan and budget.
Defining Financial Benchmarking In Clinical Development
The definition of benchmarking has changed over time, from the original (and variants), which defines it as the process of collecting and comparing a company’s operations performance data to external “best-in-class” performance.3 In pharmaceutical R&D, it’s hard to obtain data or figure out what’s “best-in-class” because of confidentiality and IP issues that surround drug development.4 In view of this, we will suggest a qualified definition whereby other yardstick can be used to ensure comparability of metrics (e.g., median, ratios, or indexes) and accurate analysis of financial benchmarking results.
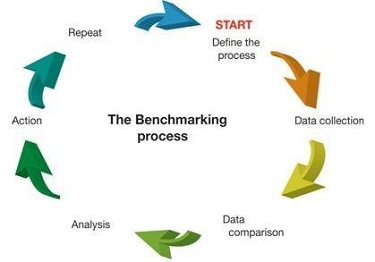
Figure 1: The benchmarking process3
Why Clinical Development Organizations Perform Cost Benchmarking
Cost benchmarking is used to support strategic financial planning, budgeting, resource allocation, research site (e.g., hospitals) budget negotiations, and process and productivity improvement. It’s mostly used by sponsors to estimate and forecast costs related to clinical trial sites, e.g., for investigator grants (per-patient cost is the most commonly used measure). There is little or no cost benchmark data for sponsors’ internal costs or for their suppliers (CROs). An informal roundtable survey during this year’s CBI Clinical Trial Budgeting and Forecasting conference (Philadelphia, May 2018) showed that benchmarking might be considered difficult in terms of defining the benefits due to lack of standardization of metrics across the industry. It was, however, suggested by a few participants that the practice can be improved if pharmaceutical companies could share their benchmarking tools and data with clinical research sites as this would enable standardization and foster adoption and cost transparency in the industry.
From our research, it appears that many pharmaceutical companies don't typically conduct financial benchmark analyses of their clinical development processes at an organizational or portfolio level. It’s mainly performed at the study level to obtain per-patient cost and procedure costs or to support their compliance process for fair market value assessments. We also learned that benchmarking is difficult to implement because of time and resource constraints, variability in study complexity, and continuously changing R&D portfolio assumptions.
Cost challenges:
- Requires time and financial resource for organization-level exercise
- Implementation of outcome will require funding
- Cost of changing established processes and company practices
Barriers:
- Finding true best-practice organizations for comparison
- Identifying valid comparable data for performance benchmarking
- Gathering information and data for benchmarking activities
- Articulating the “value proposition” or benefits of benchmarking
- Finding the financial resources needed to carry out benchmarking activities
Overview Of Cost and Budget Benchmarking Areas And Methods
It’s often reported that clinical trial grants constitute more that 40 percent of a study’s total costs; it is therefore important for pharmaceutical sponsors to ensure payments represent fair market value for services that sites perform. Benchmarking of per-patient cost and other financial value measures, e.g., ratio of direct cost (site and patient related) to indirect management cost (CROs), as illustrated in Figure 2, has been used for budget optimization and cost management.
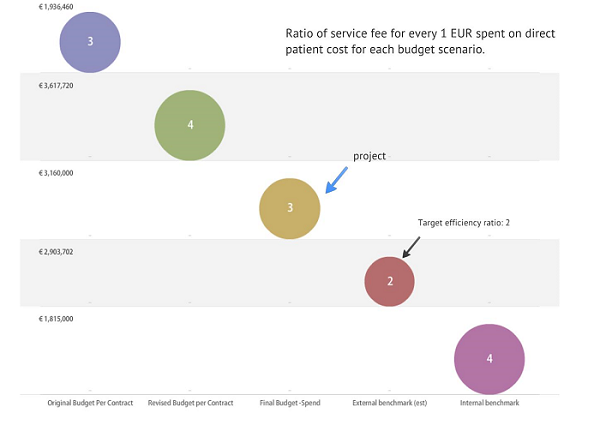
Figure 2: Using target cost efficiency ratio to manage financial performance in a Phase 3 MS program at Genzyme (Informa Budget Workshop Presentation, April 2012)
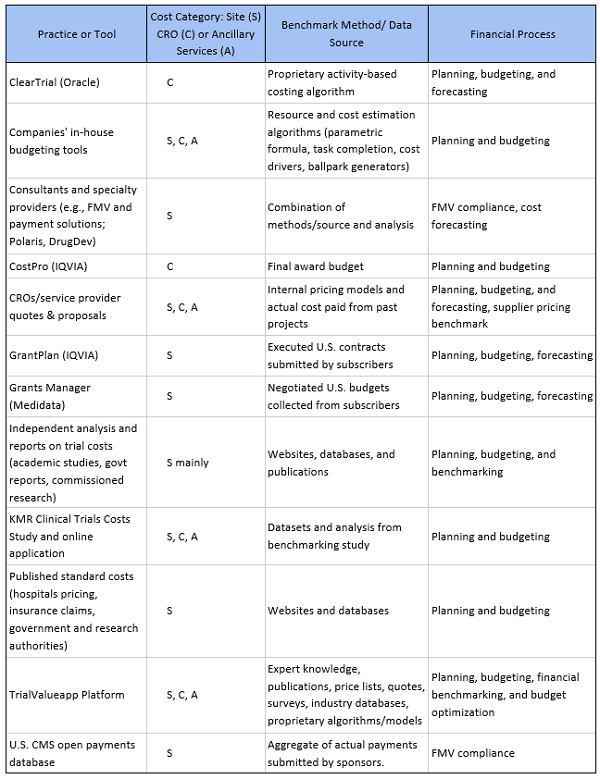
In addition, fees and costs for tasks and deliverables such as informed consent, patient visits, IRB fees, healthcare practitioner fees, routine tests, study coordinator cost per visit, pharmacy fees, patient reimbursements, and clinical trial procedure costs vary over time. Hence, it is important to determine current market prices for these items. Table 1 below provides an overview of the different strategies, practices, and tools that are available to sponsors, clinical research sites, and CROs.
Table 1: Overview of Cost and Budget Benchmarking Practices and Tools
Value Creation Through Financial Benchmarking
Financial benchmarking enables pharmaceutical sponsors to find ways to optimize cost structures, generate efficiencies through cost savings, and design program specifications to cost. With timely recruitment, monitoring, and shorter cycle times being key to the success of clinical programs, cost benchmarking has become more important to the industry as a way to manage R&D costs.
Overall financial benchmarking can act as a catalyst for improving the clinical trial processes by enabling better planning and optimal use of resources. To illustrate using a case study:
Case Study: TrialValue A.I.+: Applying machine learning enabled budget benchmarking model for financial planning and budget optimization
Using key project inputs and assumptions, such as number of patients, indication, study design, location, and phase, a machine learning algorithm predicts the fair market value investigator fee-per-patient from a proprietary cost dataset (sample size> 10K trial simulations). The results of the analysis shown in Table 2 and Figure 3, illustrate how the TrialValue A.I.+ model provides an opportunity to improve budget performance (potential savings) by 15 percent to 20 percent for investigator fees, when compared with the historical average investigator fee for oncology Phase 3 studies conducted in the period 2012 to 2013.
Table 2: Investigator Budget Benchmark for Oncology Clinical Studies Scenario Showing Mean
Historical Cost vs. TrialValue A.I.+ Optimization Prediction Model
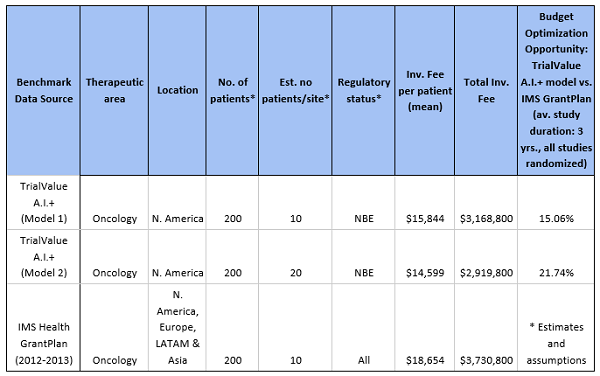
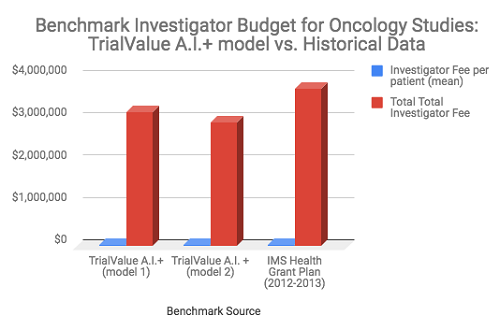
Figure 3. Comparing a machine learning benchmark model to historical cost data (Source: TrialValue A.I.+ algorithm and author’s analysis, 2018) 5
Conclusion
There is a wide range of tools and practices that are currently used for benchmarking financial process within the clinical development sector. If deployed correctly, they provide many opportunities for clinical development organizations to improve financial planning, budgeting, and performance of their investment and efforts. These benefits can be achieved if the industry adopts an open, systematic, and standardized approach to benchmarking costs, pricing, and other clinical development value measures.
References:
- Chi Heem Wong, Kien Wei Siah, Andrew W Lo; Estimation of clinical trial success rates and related parameters, Biostatistics, kxx069. Available at https://doi.org/10.1093/biostatistics/kxx069
- Morgan S, Grootendorst P, Lexchin J, Cunningham C, Greyson D; The cost of drug development: a systematic review, Health Policy, Apr. 2011, 100(1):4-17. Available at: https://www.sciencedirect.com/science/article/pii/S0168851010003659?via%3Dihub
- Ettorchi-Tardy A, Levif M, Michel P; Benchmarking: A Method for Continuous Quality Improvement in Health. Healthcare Policy 2012; 7(4):e101-e119. Available at: https://www.ncbi.nlm.nih.gov/pmc/articles/PMC3359088/
- Royal Institution of Chartered Surveyors (RICS) guidance note, global, Cost analysis and benchmarking, 1st edition, 2013. Available at: https://www.rics.org/globalassets/rics-website/media/upholding-professional-standards/sector-st andards/construction/black-book/cost-analysis-and-benchmarking-1st-edition-rics.pdf
- Mathini Ilancheran, Beroe Inc; Clinical Operations Cost Variation: Oncology vs. Non Oncology. Clinical Leader Article, Nov. 25, 2014. Available at: https://www.clinicalleader.com/doc/clinical-operations-cost-variation-oncology-vs-non-oncology-0001
About The Authors:
 Larry Ajuwon is the director and founder of RHIEOS-Ventures Ltd., a clinical development consultancy and healthcare service company. He is also the lead partner at TrialValueapp, a clinical research costing and budget benchmarking software and platform. He has over 18 years’ experience in biopharmaceutical R&D operations, with specialties in product development, business operations, financial analytics, and designing software enabled solutions. You can reach him at lajuwon@rhieosventures.co.uk or connect with him on LinkedIn.
 Mathini Ilancheran is the principal analyst of R&D for Beroe Inc. She specializes in understanding market scenarios and industry dynamics across the globe in the outsourcing arena. She has several publications related to R&D procurement opportunities. With her category knowledge, she has published 20+ articles in leading journals, co-authored with industry experts. She completed her master’s in management from University College London (UCL) and has worked as a consultant for strategic positioning projects as part of UCL advances in the U.K. You can contact her at mathini.ilancheran@beroe-inc.com or connect with her on LinkedIn.