
Clinical Trial Duration Trends & The Study Closeout Gap
By Justin Culbertson, life sciences senior analyst, RSM US LLP

While the U.S. labor market struggled throughout 2020 and 2021 to return to its pre-pandemic level of participation, the life sciences industry rebounded and exceeded its pre-pandemic labor market participation by the end of 2020 due to demand for COVID-19-related treatments and vaccines. Highlighting the unique demand that was placed upon the industry, clinical trial study starts during 2020 and 2021 met or exceeded pre-pandemic starts.
However, increased demand has not come without cost. Study durations in research are increasing. Contributing significantly to those durations is what we will refer to as a study closeout gap. Are companies positioned to reverse this trend and ultimately reduce time to market for groundbreaking new drugs and therapies? We’ll explore this trend of increasing study duration as well as related labor challenges and macroeconomic trends.
Active Clinical Trials And Study Duration
Clinical trial study starts during 2020 and 2021 met or exceeded study starts in the immediately preceding years. Even excluding COVID-19 studies, study starts in 2021 exceeded those in 2019. The accelerated “return to normal” for non-COVID-19 studies combined with COVID-19 activity contributed to a record level of active clinical trials. According to the ClinicalTrials.gov database, there are currently over 16,000 active industry-funded interventional studies.

Source: RSM US LLP; ClinicalTrials.gov. The blue is forecasted potential additional trials (Covid or non-Covid) for 2022.
As study volume increases, there is a shift taking place between early and late-stage studies. Phase 1 and 1/2 studies (those studies that combine Phase 1 and Phase 2 clinical trials into a single protocol) are making up approximately 45% of all study starts compared to approximately 35% 10 years ago. This highlights the increasing emphasis on innovation in the life sciences industry. According to The IQVIA Institute’s Global Trends in R&D 2022, there are over 6,000 products in active development globally, which is an increase of 68% from 2016. Additionally, over 1,200 of these products relate to rare and orphan diseases that have been historically undertreated but are becoming more accessible to research through virtual technologies.
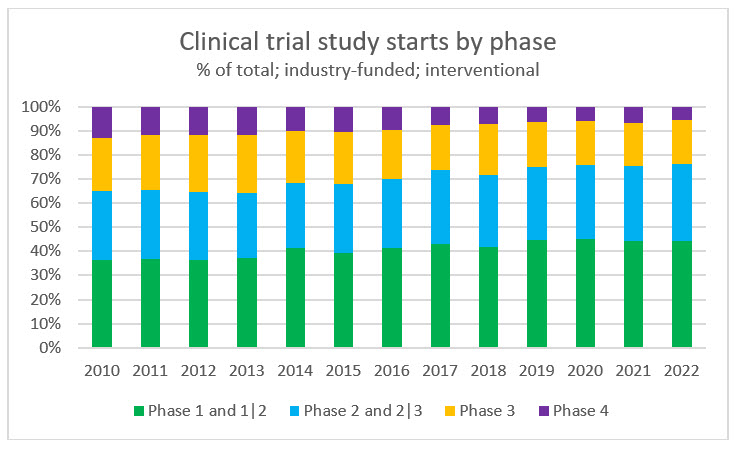
Source: RSM US LLP; ClinicalTrials.gov
Clinical trial Duration And The Study Closeout Gap
As mentioned, there are currently over 16,000 active industry-funded interventional studies in the ClinicalTrials.gov database. Contributing to this all-time high of active studies, study duration has been steadily increasing over the past decade. Clinical trial phase 3 duration has increased from approximately 2.25 years in 2010 to 3.25 years in 2021. Interestingly, the duration to primary completion date (the date on which the last participant in a clinical study was examined or received an intervention to collect final data for the primary outcome measure) shares equal responsibility for the increase with the study closeout process.
The average duration to primary completion date has increased from approximately 1.7 years in 2010 to 2.3 years in 2021. This is an increase of approximately 0.6 years or 7 months. Meanwhile, the increase in the study closeout timeline has increased from approximately 0.1 years in 2010 to 0.5 years in2021. This is a four-fold increase of approximately 0.4 years, or 5 months. I refer to this as the study closeout gap.
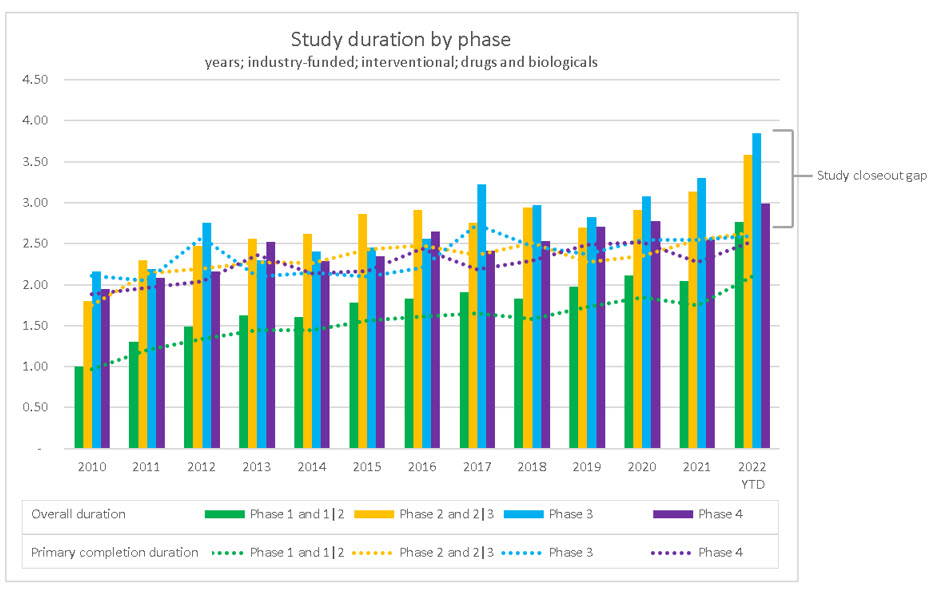
Source: RSM US LLP; ClinicalTrials.gov
While complexity continues to be a topic of discussion in the study duration conversation, one might wonder whether “complexity” refers to increasing complexity in the science, research methodologies, or other operational matters. In considering the science, we noted that there has been a shift in the mix of drug studies to the longer-duration biological studies. By our estimates, approximately 10 to 15% of studies starting in 2010 were related to biological treatments, compared to 15 to 20% in 2021. The IQVIA Institute’s Global Trends in R&D 2022 identified over 800 next-generation biotherapeutics in development in 2021, encompassing CAR T-cell therapy to fight cancer, cell therapy, gene therapy, and RNA therapeutics. Further, The IQVIA Institute stated that the next-generation pipeline has seen a compound annual growth rate of 27% since 2016.
When we consider the complexity in areas outside of the science, such as in the research methodologies or other operational processes, we believe that the increase in the length of clinical trials has more to do with the growing study closeout gap exacerbated by the tight labor market.
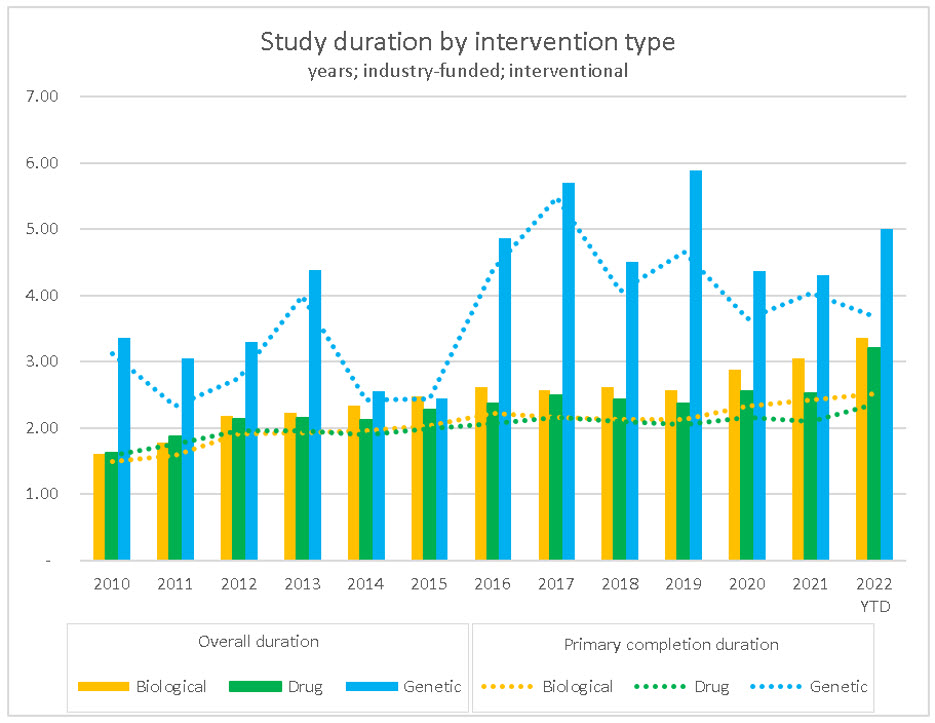
Source: RSM US LLP; ClinicalTrials.gov
Labor Constraints And The Funding Slowdown
The U.S. economy has been faced with unprecedented labor demand reflected by nearly two job openings for every available worker. While the U.S. economy took nearly two years to return to its pre-pandemic labor participation, the life sciences industry saw labor participation at or above its pre-pandemic level in less than one year. While this return highlights the demand placed on the sector to fight a global pandemic, it also highlights the existing demand that was on the industry before the pandemic began.
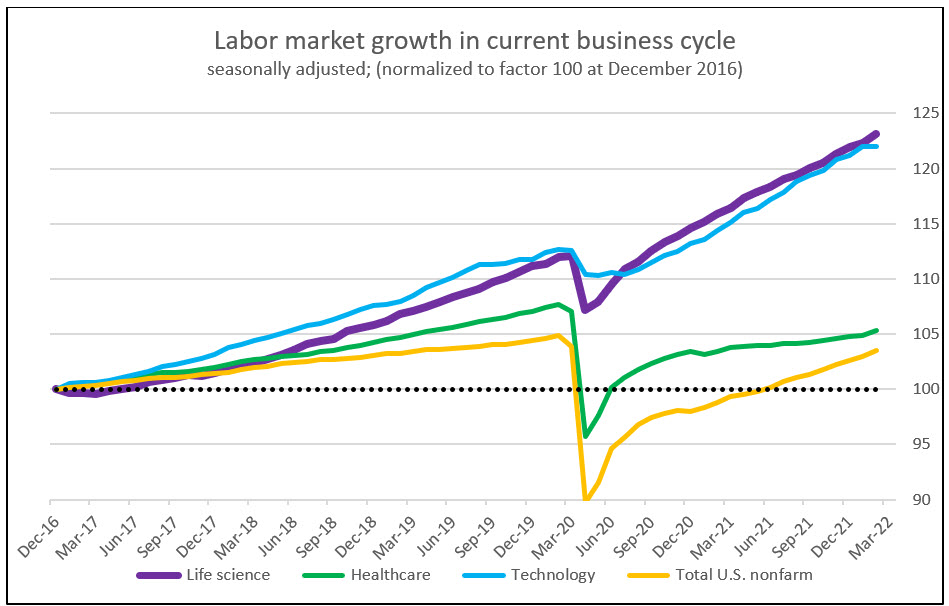
Source: RSM US LLP; Bureau of Labor Statistics. “Nonfarm” is a standard BLS description that means the labor data includes all US workers except farm workers and a few other job descriptors.
Prior to the start of the pandemic, life sciences employment outpaced healthcare while slightly lagging behind technology. This narrative changed during the pandemic when unprecedented life sciences demand accelerated employment growth beyond the technology industry. Catalyzed by this high demand, life sciences wages grew at a CAGR of 3.4% compared to total U.S. nonfarm growth of 2.4% since 2004. This trend has seen some reversion in recent periods. In December 2021, and for the first time in two years, the consumer price index outpaced life sciences wage growth, albeit by only 0.1%.
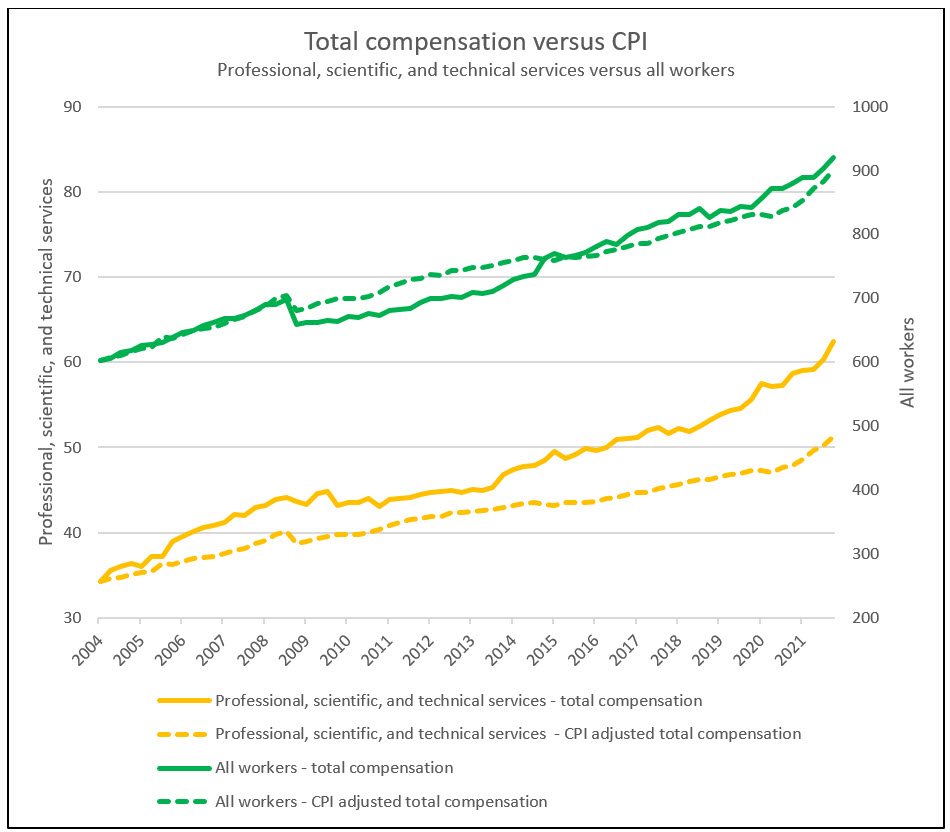
Source: RSM US LLP; Bureau of Labor Statistics
In the context of the overall U.S. economy, labor demand may be unrealistic. In a recent article by Tuan Nguyen, U.S. economist at RSM US LLP, he lays out how companies are ambitiously forecasting growth in excess of expected consumption. This has created a gap between companies’ desires to fill positions and employment actually needed to meet consumption.
Is this scenario of over-forecasting analogous to the life sciences industry? The answer to that question isn’t as clear.
First, with active and new clinical trials as a measure of demand, large clinical research organizations are not reporting a significant over-forecasting of demand. In fact, most are reporting an increase in requests for proposals. There are currently over 16,000 active interventional and industry-funded studies – the highest in history. Second, the industry sustains itself on long-term clinical trial contracts that can last several years. Because of this contract backlog, the industry is less susceptible to missing demand forecasts. Third, it is possible that the gap between labor demand and consumption for the life sciences industry represents intangible investment not measured through gross domestic product.
While it is challenging to measure these realities in the near term, executives may want to reevaluate growth plans and ask themselves whether their existing forecasts are carrying forward a period of hyper growth seen during the post-pandemic rebound or accurately reflecting expected future realities.
The Takeaway
The duration of clinical trials is increasing. Phase 3 study duration has increased by approximately one year in the past decade, driven primarily by study complexity and a tight labor market.
There is currently a record high number of active interventional clinical trials. As CROs focus on servicing this existing client base, they must reevaluate their operating models and improve process inefficiencies. The significant increase in the study closeout gap points to labor challenges but also operational inefficiencies. If a company is having trouble hiring additional workers because of a tight labor market, it must focus on driving operational efficiencies to service its existing clients and projected demand.
Investment, particularly intangible investment, is key for the long-term success of the industry. In a separate article, Explosive Investment In Virtual Trial Companies The Latest Data, we explored a new crop of companies that are investing heavily in technology platforms to drive clinical trial efficiencies. Many of these companies are working directly with sponsors, while others are assisting legacy CROs. Identifying the appropriate technology partner, or potential acquisition target, will be key to the success of legacy CROs. The existing labor market is preventing hiring to remediate labor challenges. Therefore, companies must make intangible investments to drive operational efficiencies, or their clients, people, and society will ultimately foot the bill.
About The Author:
 Justin Culbertson is a director and senior life sciences analyst at RSM US LLP. He has more than 10 years of experience serving publicly traded and privately held companies through technical accounting and financial reporting services. He focuses on clinical research organizations (CROs) and similar service organizations in the life sciences industry. Justin has previously advised clients in the areas of new standard implementation, external audit, internal audit, risk management, mergers and acquisitions, process design and improvement, and internal and external financial reporting. He is also a member of RSM’s life sciences national industry leadership team.